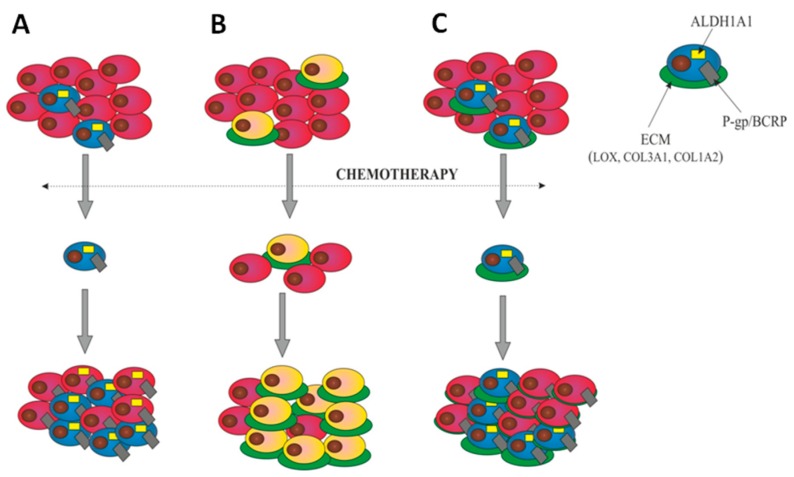
Figure 10.
Models of drug resistance development. (A) Cancer stem cells (CSCs) model—a small population of cells, characterized by ALDH1A1 expression (blue) is intrinsically resistant to chemotherapy. These cells present high levels of ABC transporters like P-gp and/or BCRP and other drug-resistant proteins. Only these cells survive chemotherapy. After therapy, they divide and repopulate the tumor mass composed of the stem cells and differentiated cells derived from the stem cells and resistant to chemotherapy as well. The number of CSCs after chemotherapy increases. (B) The ECM-related model suggests that cells with a high level of ECM component expression (yellow/green) are resistant to chemotherapy. Only the cells with high ECM expression survive therapy and are able to induce resistance in neighboring cells via CAM-DR. The content of cells expressing ECM molecules after chemotherapy increases. (C) Our model of CSCs/ECM establishes that ALDH1A1-positive CSCs express a high level of drug transporters like P-gp or BCRP as well as high level of ECM proteins (blue/green). These cells survive chemotherapy and then divide and repopulate the tumor mass. After therapy the content of CSCs/ECM cells in the tumor mass increases and all of them are resistant because of the high level of drug transporters expression. Most of CSCs demonstrates the high level of ECM molecules protecting them, and surrounding cells (CAM-DR), against chemotherapy.

