Figure 4.
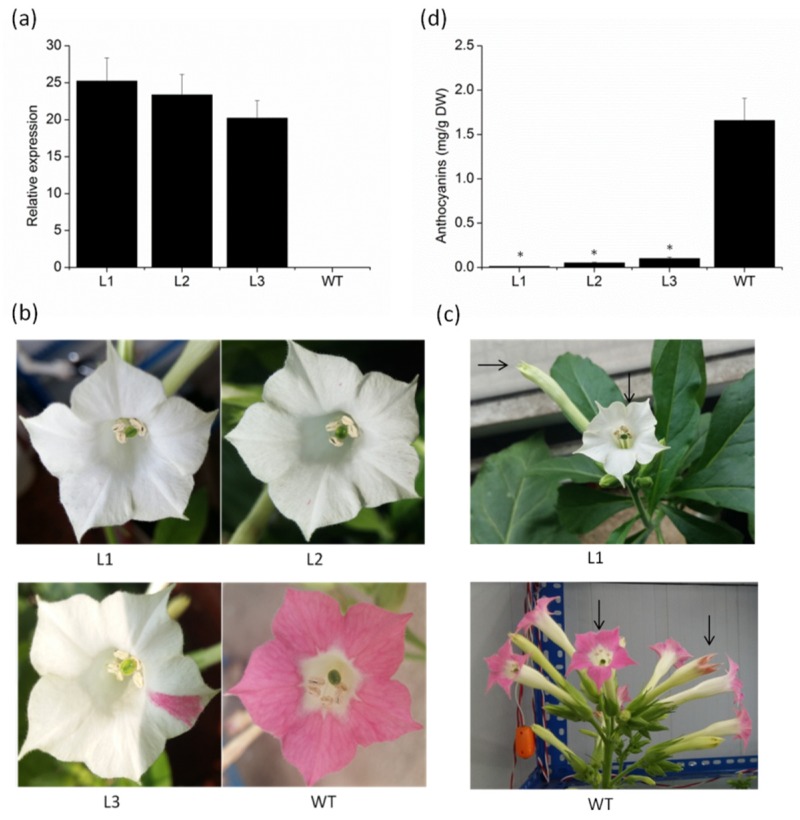
The phenotypes and anthocyanin concentrations of VvMYBC2L2-overexpressed transgenic tobacco flowers. (a) Expression levels of VvMYBC2L2 transcripts in wild-type (WT) and transgenic plants. L1, L2, L3 represent three transgenic tobacco lines. Bars represent mean ± SD. Transcript levels were measured by RT-PCR analysis and the expression data were normalized against the expression of NtActin. (b) Typical floral phenotypes of WT and transgenic plants. (c) The color of transgenic and WT tobacco flowers at different flower stages. (d) The anthocyanin concentrations in WT and transgenic petals. Anthocyanins were extracted with methanol containing 1% (v/v) hydrochloric acid, and the absorbance of the solution was measured with a UV-Visible Spectrophotometer. Bars represent mean ± SD. Significant differences from the WT were confirmed by ANOVA and Tukey’s test (* p < 0.05).

