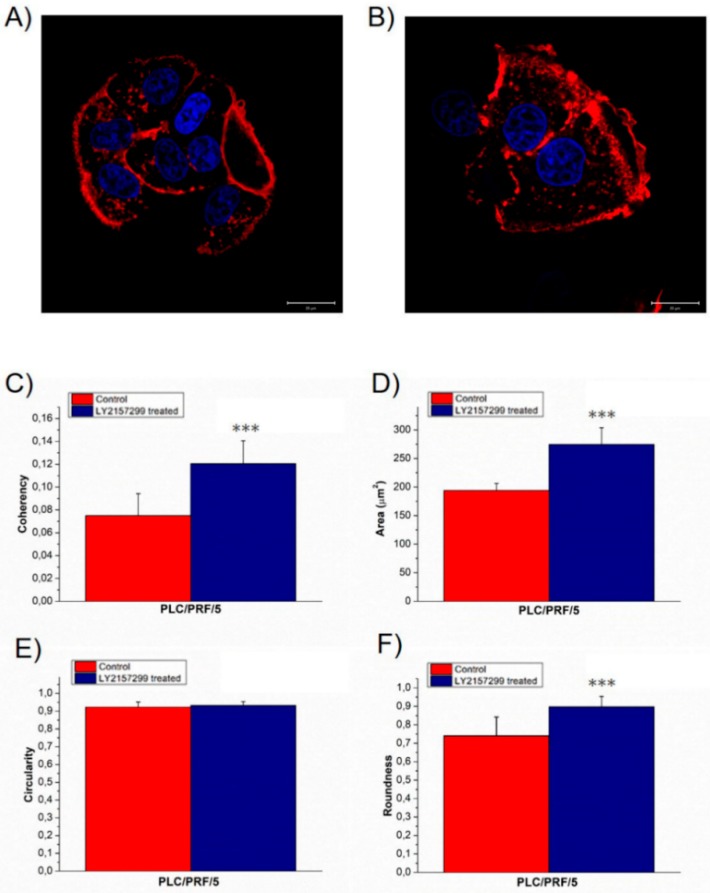
Figure 3.
Representative confocal images of PLC/PRF/5CTR (A) and TGF-β treated for 48 h, PLC/PRF/5TGF-β1 (B); the scale bar in the figures correspond to 20 µm. In the panel the value of F-actin coherency (C), nuclear area (D), circularity (E) and roundness (F) were reported. The analysis of F-actin and nuclear morphology of control and TGF-β1 treated PLC/PRF/5 cells, by using ImageJ software. Results were statistically significant for p < 0.005 (indicated as ***).

