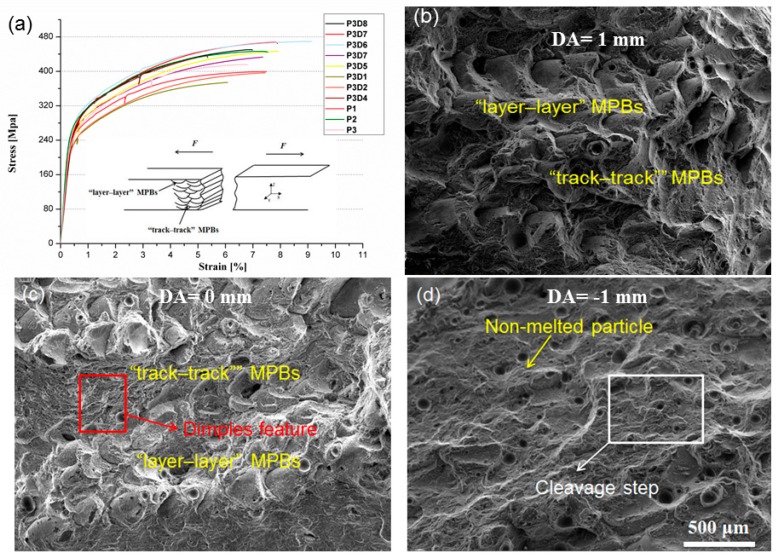
Figure 9.
Engineering stress–strain curves of the as-built samples of horizontal direction at different laser power and DA, the Illustrations is the stress cross sections of the horizontal SLMed samples (a); the SEM image shows the fractured surface of SLM AlSi10Mg samples with the characteristic microstructure at laser power of P = 320 W and fixed scanning speed of 1400 mm/s but various DA of (b): 1 mm; (c): 0 mm; (d): −1 mm.

