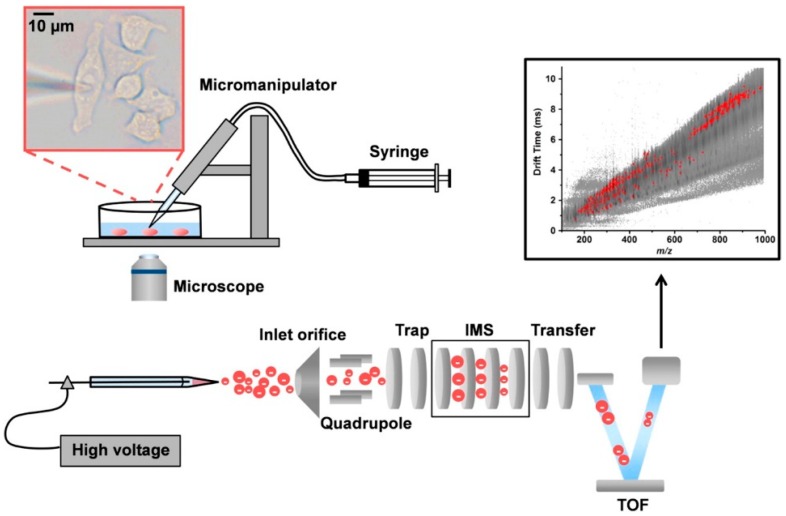
Figure 7.
Schematic representation of experimental setup for single cell analysis using capillary microsampling ESI-ion mobility spectrometry (IMS)-MS. The pulled capillary is held by a micromanipulator and inserted into the cell. The cell content is then extracted with a syringe connected to the capillary. The inset shows a microscope image taken from an inverted microscope. After extraction, the capillary is filled electrospray solution, placed near the MS inlet, and subjected to a voltage to generate an electrospray. The resulting ions are separated by drift time (DT) ion mobility spectrometry (IMS) prior to MS analysis on a time of flight (TOF) MS. The resulting analytes are plotted by DT versus mass-to-charge ratio (m/z). Reprinted with permission from https://pubs.acs.org/doi/abs/10.1021/acs.analchem.5b02502 [52]. Further permissions related to the material excerpted should be directed to the American Chemical Society.

