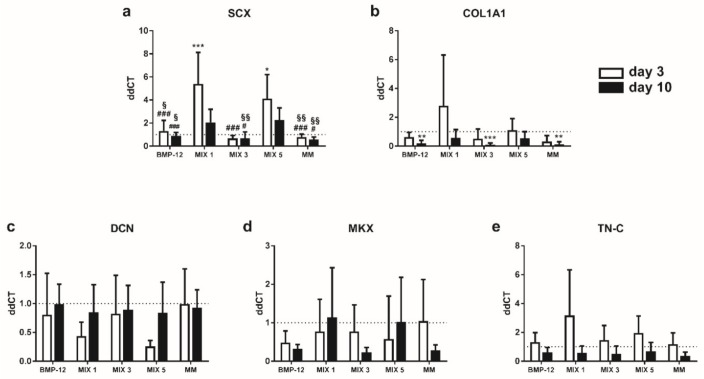
Figure 5.
Expression of tendon-specific markers by BMSCs at 3 and 10 days after tenogenic induction. Expression levels of (a) SCX; (b) COL1A1; (c) DCN; (d) MKX; (e) TN-C in BMSCs after tenogenic induction. Data are expressed as mean ddCT ± SD normalized to YWHAZ and CTRL sample. n = 7. * p < 0.05; ** p < 0.01; *** p < 0.001 vs. CTRL. # p < 0.05; ### p < 0.001 vs. MIX 1. § p < 0.05; §§ p < 0.01 vs. MIX 5.

