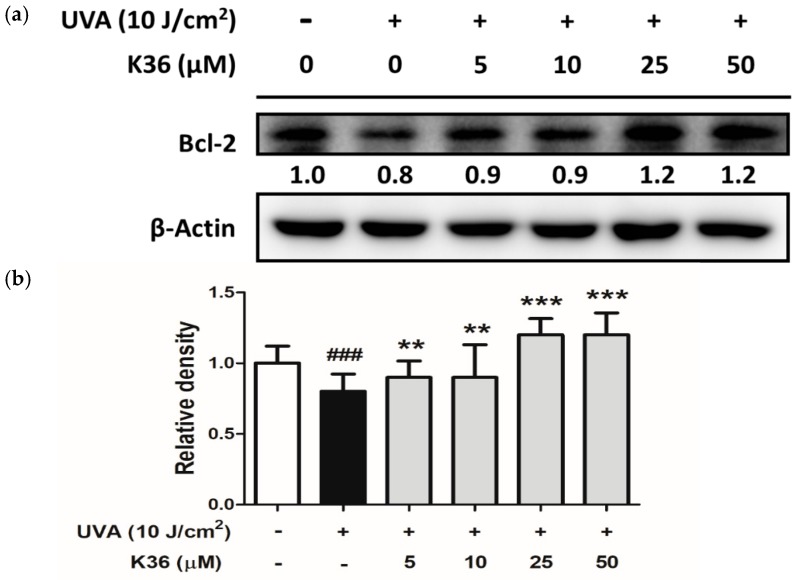
Figure 10.
Effect of K36 on UVA-induced Bcl-2 expression in human epidermal keratinocytes. The representative image of the western blot (a) and the average value of the triplicate experiment (b); significant difference versus nonirradiated group: ###, p < 0.001; significant difference versus irradiated and nontreatment group: **, p < 0.01; ***, p < 0.001. The bars and error bars present as mean ± SD. White column is non UVA-irradiation and non K36 treated group, black column is UVA-irradiation and non K36 treated group, and grey column is UVA-irradiation with various concentration of K36 treatment group.

