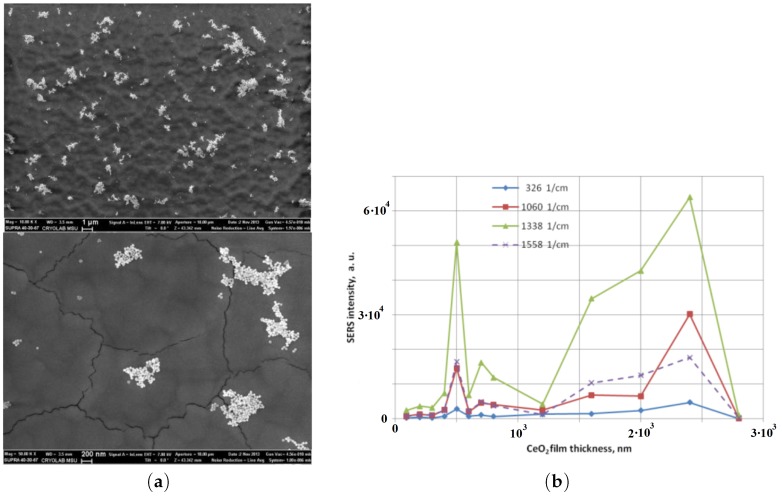
Figure 10.
(a) SEM images of facet films with gold nanoparticles (AuNP); scale bars are m and nm for the top and bottom images, respectively; (b) SERS intensity for four Raman shifts from conjugate of DTNB/AuNP on films as function of the film thickness (after normalization that is the Raman signal is divided into the number of AuNP in the spot, where the signal is collected from).

