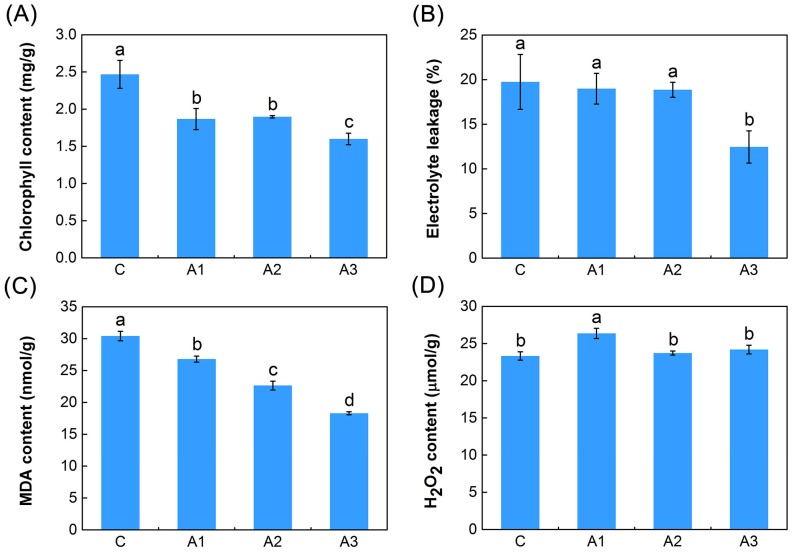
Figure 1.
Analyses of dynamic physiological effects under continuous ABA treatment. (A) Chlorophyll content. (B) Electrolyte leakage. (C) Malonaldehyde (MDA) content. (D) Hydrogen peroxide (H2O2) content. C represent control; A1, A2 and A3 represent ABA treatment for 1, 3 and 12 h, respectively. The results are the means and standard deviation (SDs) of the three replicates. Different letters above the bars indicate significant difference treatments (Duncan’s multiple range test; p < 0.05).

