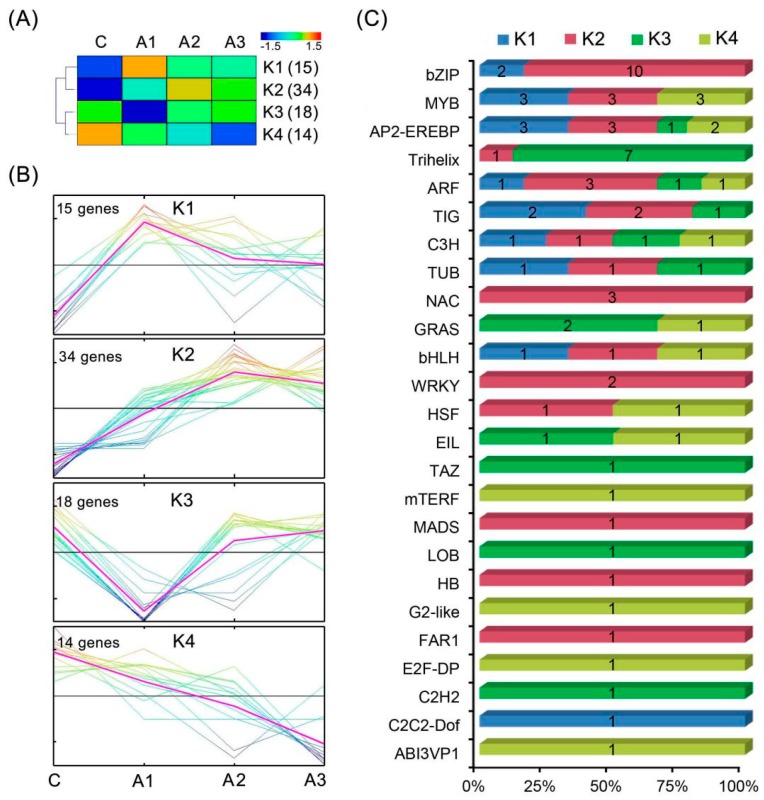
Figure 7.
Dynamics of transcription factor accumulation profiles. (A) All significantly differentially expressed TFs from all analyzed ABA-treated time points were clustered into four lineages (K1–4) using the MEV 4.9 software with the Self-Organizing Tree Algorithm (SOTA) method; (B) The dynamic expression of the TFs in each of the four clusters was analyzed using the MEV4.9 software with the K-means clustering method. (C) The distribution of TFs in each TF family among K1–4. C, A1, A2 and A3 represent ABA treatment for 0, 1, 3 and 12 h, respectively.

