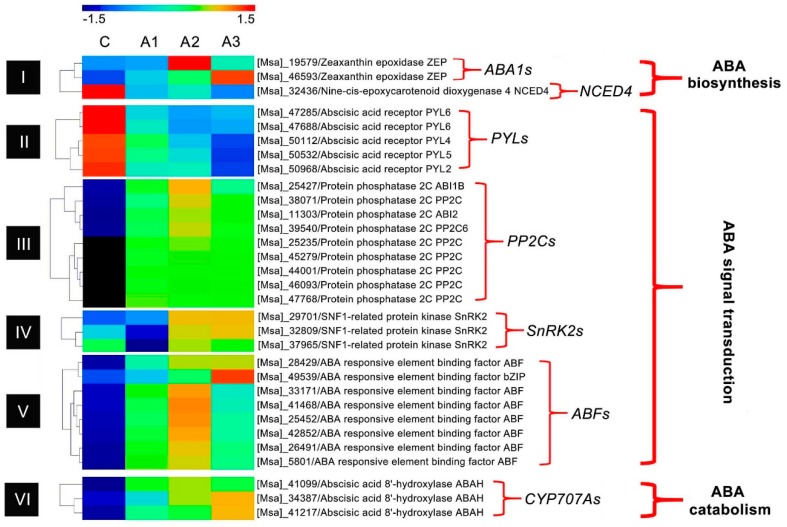
Figure 9.
Transcriptional expression of ABA signal core components. C, A1, A2 and A3 represent ABA treatment for 0, 1, 3 and 12 h, respectively. Heat map showing all DEIs involved in the ABA regulatory pathway using the MEV4.9 software with the hierarchical clustering method. The gene expression is based on the z-scores of log2 (FPKM) value. The red and blue colors indicate high and low expression levels, respectively.

