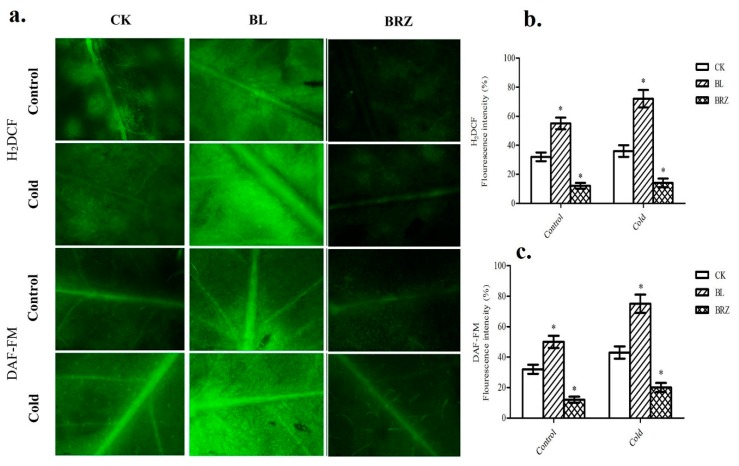
Figure 3.
BRs’ role in the generation of hydrogen peroxide (H2O2) and nitric oxide (NO). M. truncatula plants pretreated with 1 μM BL or 1 μM BRZ or water (CK). Images were taken after 24 h of chemical treatment using a fluorescence microscope (Scale bars = 75 μm) (a). Quantitative measurements of H2O2 level (b) and NO level (c) in young leaves. Bars represent mean and standard deviation of values obtained from three biological replicates. Significant differences (p < 0.05) are denoted by asterisks.

