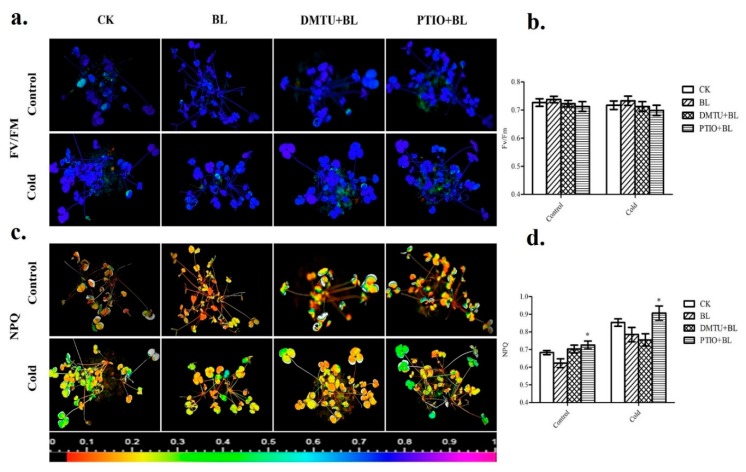
Figure 6.
Chlorophyll fluorescence parameters were determined with an imaging PAM (IMAG-MAXI; HeinzWalz). Images and values of the FV/FM (a,b) and NPQ (c,d) in various treatments. The false color code depicted at the bottom of the image ranged from 0 (black) to 1.0 (purple). All the leaf samples were collected at the same time every day. Bars represent mean and standard deviation of values obtained from three biological replicates. Significant differences (p < 0.05) are denoted by asterisks.

