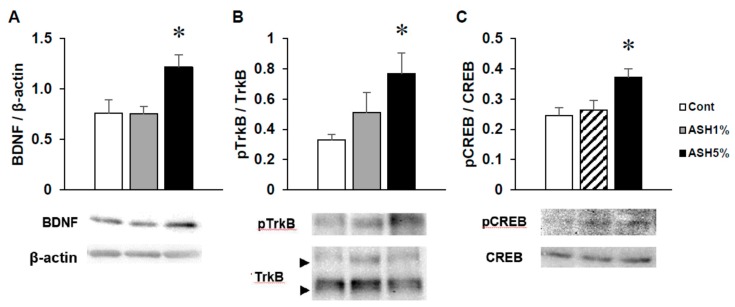
Figure 6.
Effects of ASH on hippocampal BDNF signaling. Analysis of hippocampal (A) BDNF, (B) phosphor-TrkB (p-TrkB), and (C) p-CREB protein levels by Western blotting. BDNF was normalized to β-actin, whereas p-TrkB and p-CREB were normalized to total TrkB and CREB. Each data item showed the ratio vs. Cont. Data are presented as mean ± SE; n = 4–5; statistical significances are denoted by * p < 0.05 compared with the Cont. group (Dunnett’s t-test).

