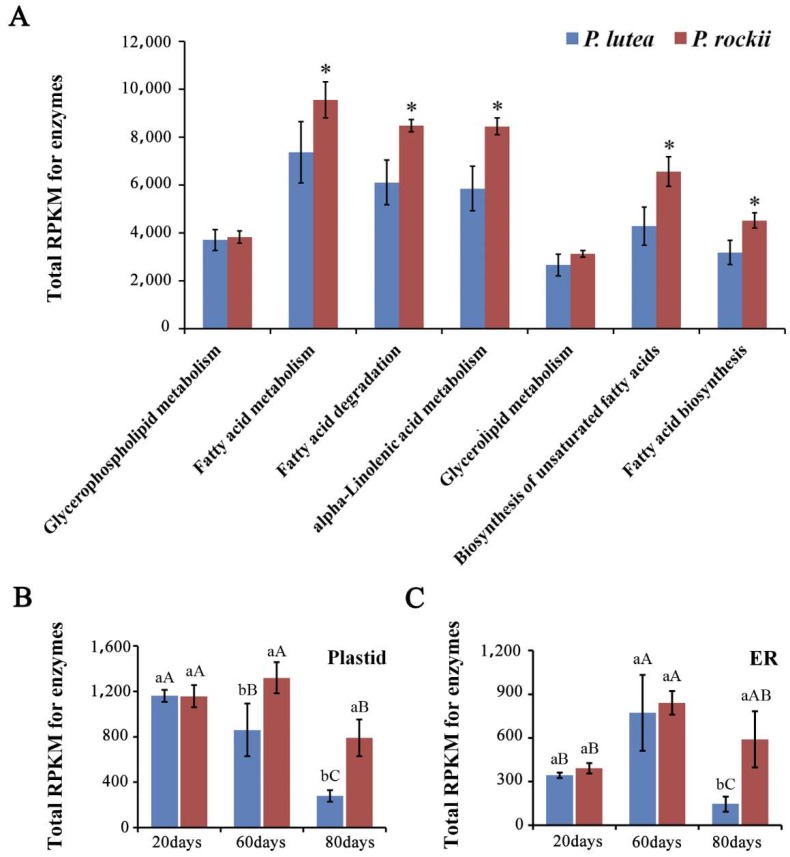
Figure 2.
Transcriptome analyses of developing seeds of P. lutea and P. rockii. Total transcript levels for unigenes representing the (A) top seven lipid pathways (Table S2), (B) fatty acid synthesis in the plastid and (C) triacylglycerol assembly in the endoplasmic reticulum (ER; Table S4). RPKM: reads per kilobase per million. The asterisks indicate significant differences (* p < 0.05, Student’s t-test). Different small letters indicate significant differences between the species at the same time point at p < 0.05 level, as determined by the least significant differences test. Different capital letters indicate significant differences among different time points for the same species.

