Figure 1.
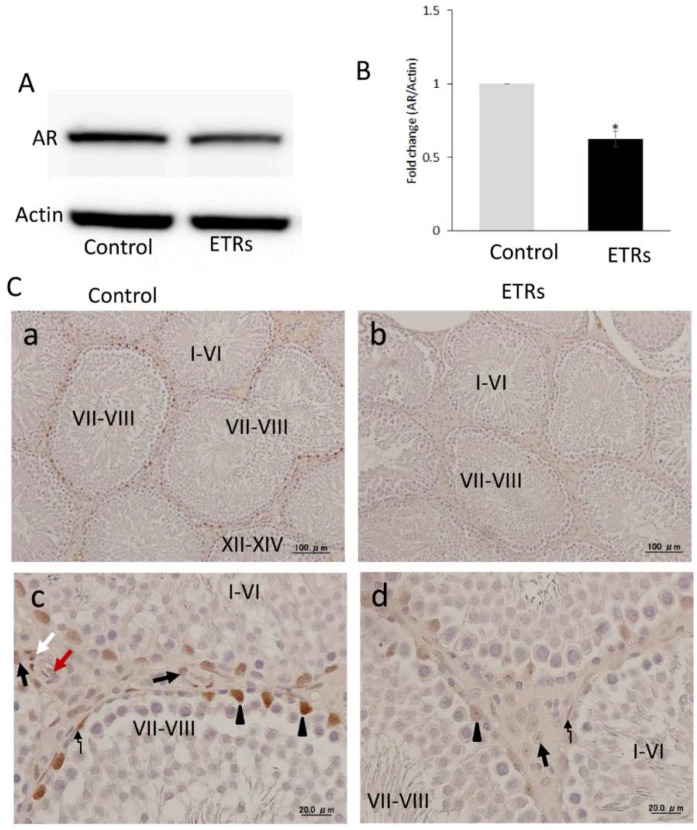
Ethanol-induced reduction of androgen receptor (AR) expression in ETRs testes. (A,B) Western blot analysis for AR. The relative expression level for protein was normalized to actin and expressed as fold change relative to the control (n = 3). * p < 0.01 compared to the control group. (C) Immunohistochemistry (IHC) of AR in control (a,c) and ETRs (b,d). Arrow heads indicate nuclear staining of AR in SCs, while broken arrows mark its expression in myoid cells. The black and white arrows indicate the expression of AR in Leydig cells and smooth muscles of blood vessels, respectively (red arrow: blood vessel lumen).

