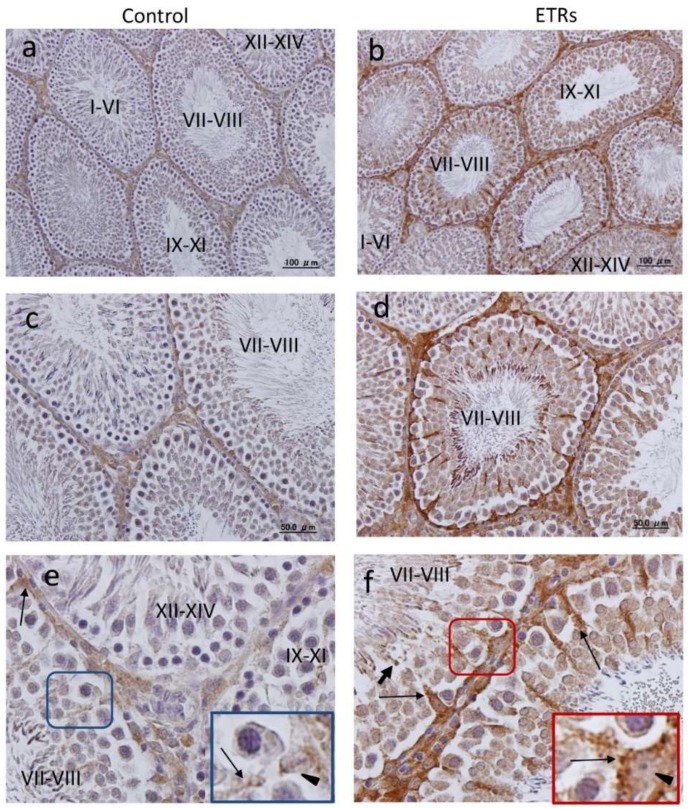
Figure 2.
Immunolabeling for LC3 with highest expression in SCs of ETRs at stages VII–VIII of spermatogenic cycle. ((a,c,e) control group; (b,d,f) ETRs). Higher magnifications of framed areas in (e,f) showing LC3 puncta (long arrows) in SCs are shown in the insets. The short arrows indicate LC3 dots in RBs. Black arrow heads mark SC nuclei.

