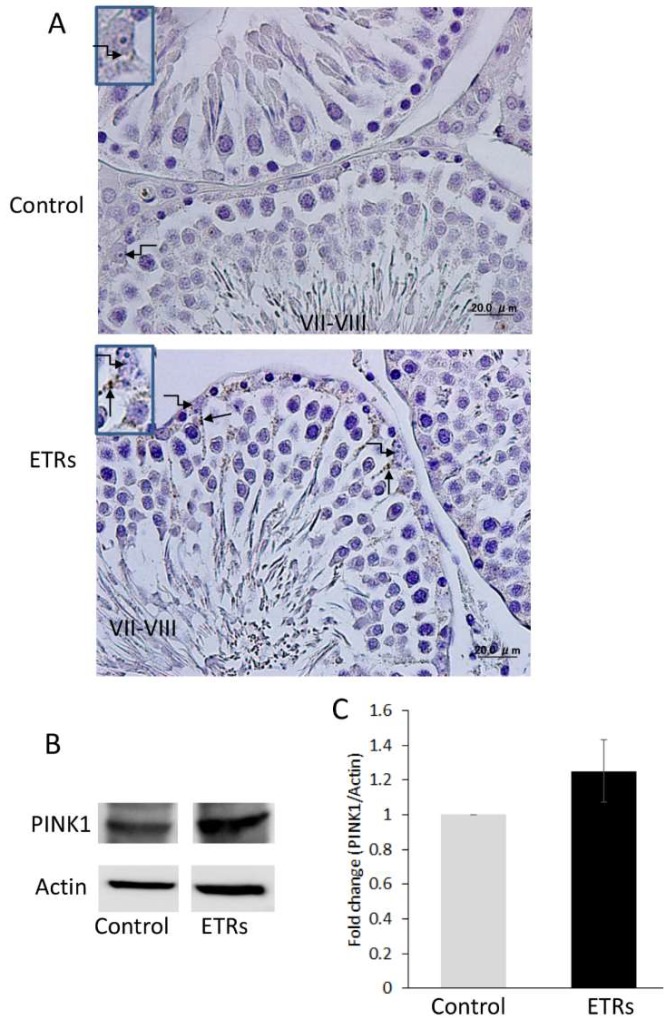
Figure 7.
Overexpression of PINK1 in SCs of ETRs indicating mitochondrial damage. (A) IHC of PINK1. Note the perinuclear localization of PINK1 (arrows). The broken arrows indicate SC nuclei. The inset shows magnified SC nuclei; (B,C) Western blot analysis of PINK1. The relative expression level for protein was normalized to actin and expressed as fold change relative to the control (n = 3).

