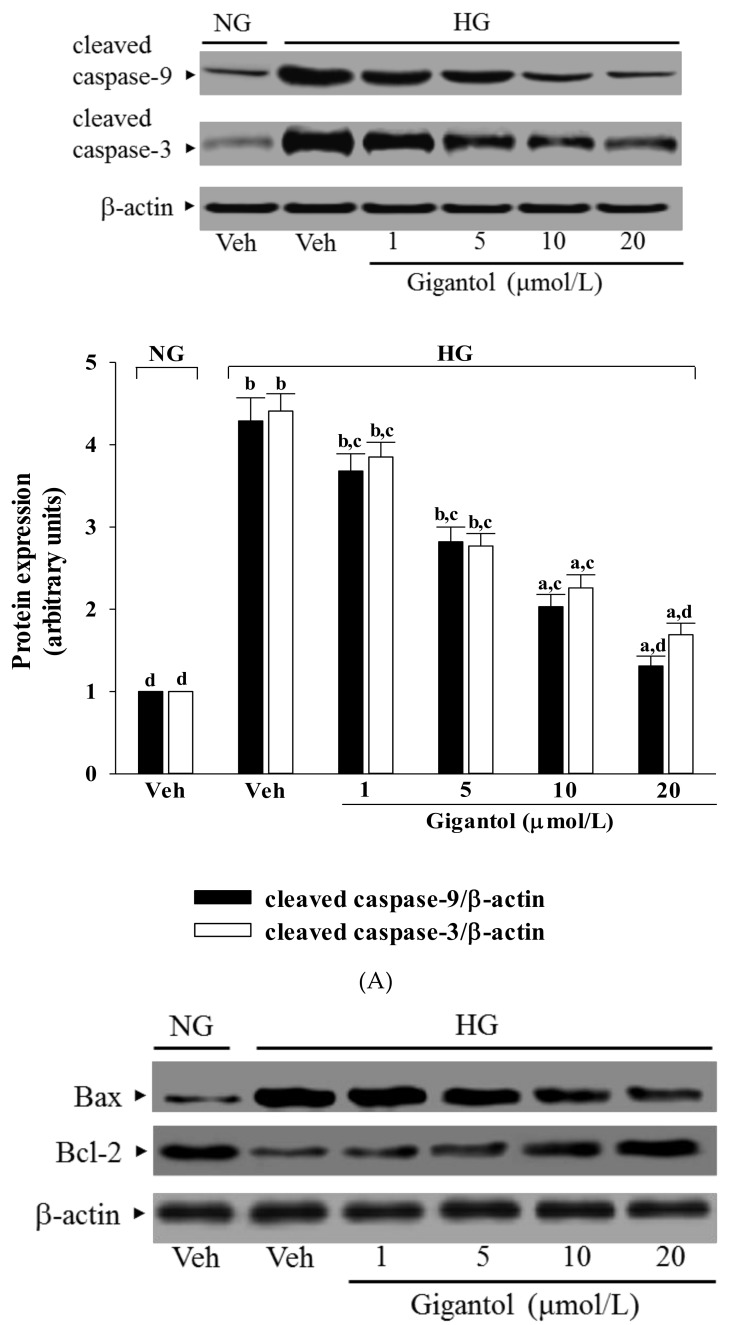
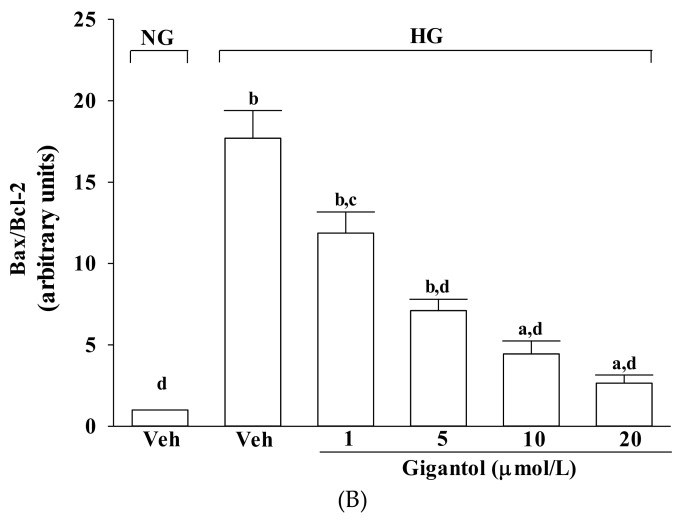
Figure 4.
Effects of gigantol on protein expression related to apoptosis in MES-13 cells under high glucose conditions. Cells were pretreated with different concentrations of gigantol (1, 5, 10 or 20 μmol/L) for 1 h and then exposed to normal (NG) or high (HG) glucose for an additional 48 h. (A): The photographs are representative western blots for cleaved caspase-9 and cleaved caspase-3. The quantitative cleaved caspase-9 and cleaved caspase-3 expression levels are listed in the lower pannel. (B): The densities of protein bands for Bax or Bcl-2 were quantitated and the ratio of Bax to Bcl-2 was calculated. The experiments were performed in triplicate and data are presented as the mean ± SD of five independent experiments (n = 5). a p < 0.05 and b p < 0.01 when compared to the normal glucose vehicle (Veh)-treated control group. c p < 0.05 and d p < 0.01 when compared to the high glucose vehicle-treated group.


