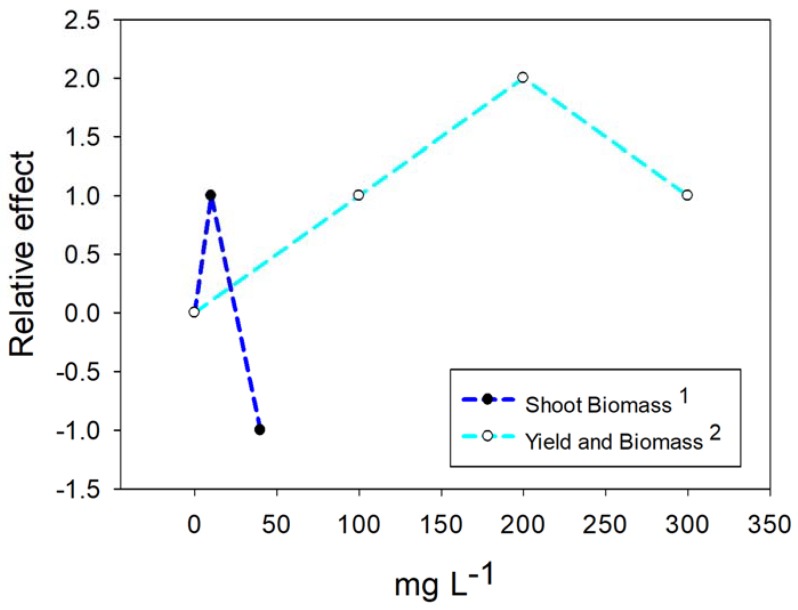
Figure 5.
The relative effects of TiO2 NPs application on plants. On the Y axis the zero number represents the control treatment, a positive value represents a positive effect of the NPs, and a negative value represents an adverse effect on the specified variable. The superscript indicates the reference: dragonhead plants 1 [85], and wheat plants 2 [80].

