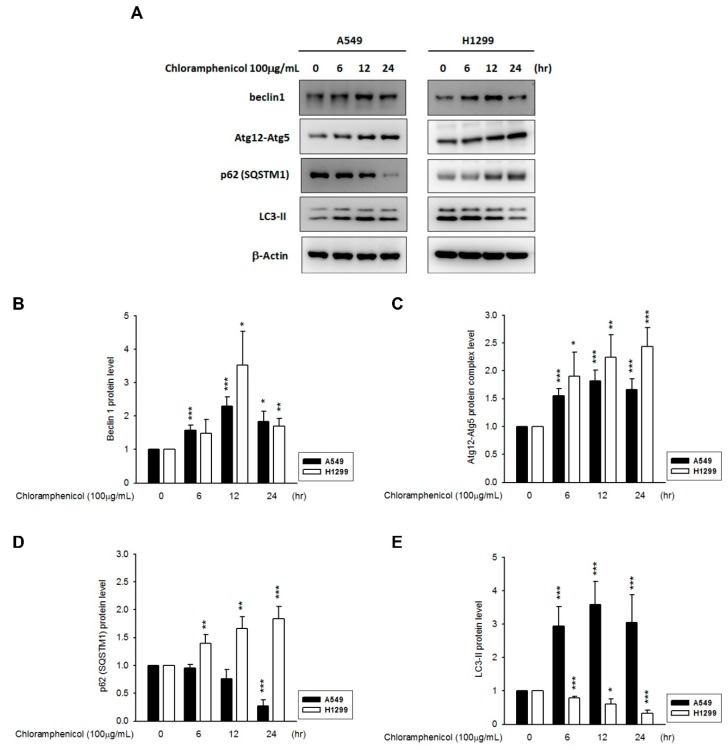
Figure 4.
Chloramphenicol induced autophagy in NSCLC cells in a time-dependent manner. (A) Representative images showing the changes in levels of autophagy biomarkers (beclin 1, Atg12-Atg5 conjugates, p62/SQSTM1, and LC3-II) in A549 and H1299 cells in response to chloramphenicol treatment. Quantitative results of multiple experiments are shown for (B) beclin 1, (C) Atg12-Atg5 conjugates, (D) p62/STSQM1, and (E) LC3-II. (* p < 0.05, ** p < 0.01, and *** p < 0.001 indicates statistically significant difference from the control group). N = 5 (A549) and 3 (H1299).

