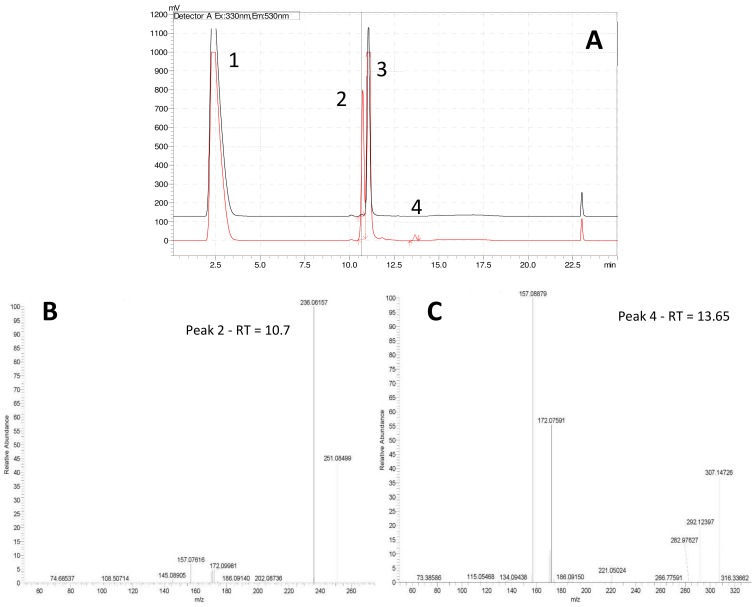
Figure 3.
(A) HPLC-fluorescence chromatogram comparing f/2 blank (black line) and IRI-160AA (red line): 1 = DNS-OH, 2 = DNS-NH3, 3 = DNS-glycine, and 4 =DNS-n-butylamine. Lower panels: Fragmentation patterns (MSMS spectra) of peaks 2 and 4 confirming the presence of DNS-NH3 (B) and DNS-n-butylamine (C).

