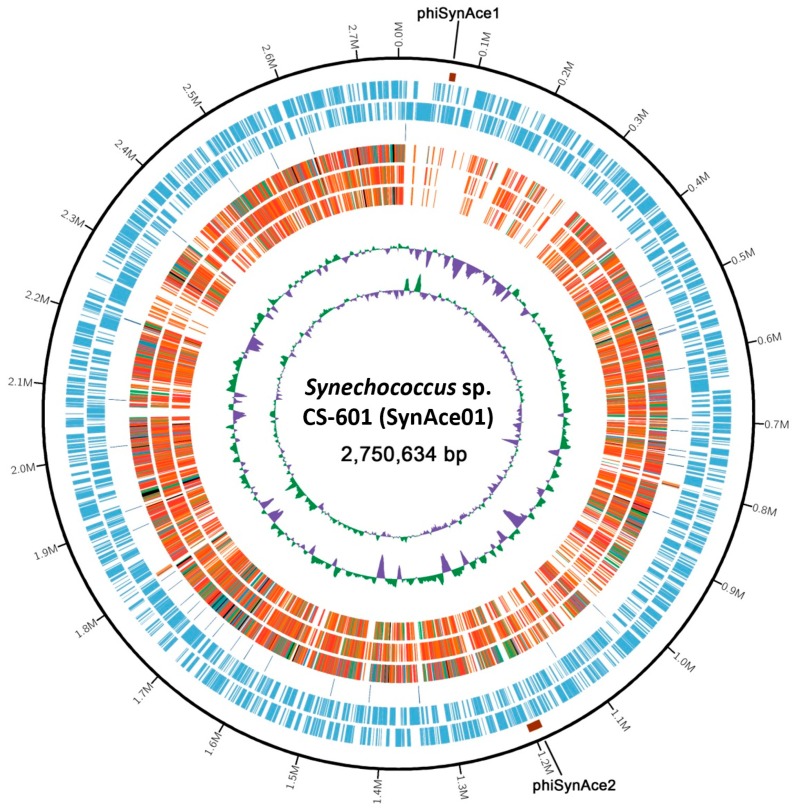
Figure 1.
Circular plot of Synechococcus sp. CS-601 (SynAce01) genome. Rings are as follows (outer–inner): Two prophages of phiSynAce1 and phiSynAce2; protein-coding sequences (CDS) on plus strand; CDS on minus strand; rRNA (orange) and tRNA (blue); the fifth to seventh circles represent the shared amino acid identities of Basic Local Alignment Sequence Tool-Protein Search (BLASTP) alignments with Synechococcus sp. WH8102, S. elongatus PCC 7942, and P. marinus MED4, respectively; the last two circles represent GC content and GC skew both calculated for a 10-kb window with 1-kb stepping. The colour scheme for the heat map of orthologs is as follows, black, orthologs ≥90% identity; blue, 80–90% identity; green, 70–80% identity; red, 50–70% identity; orange, 30–50% identity.

