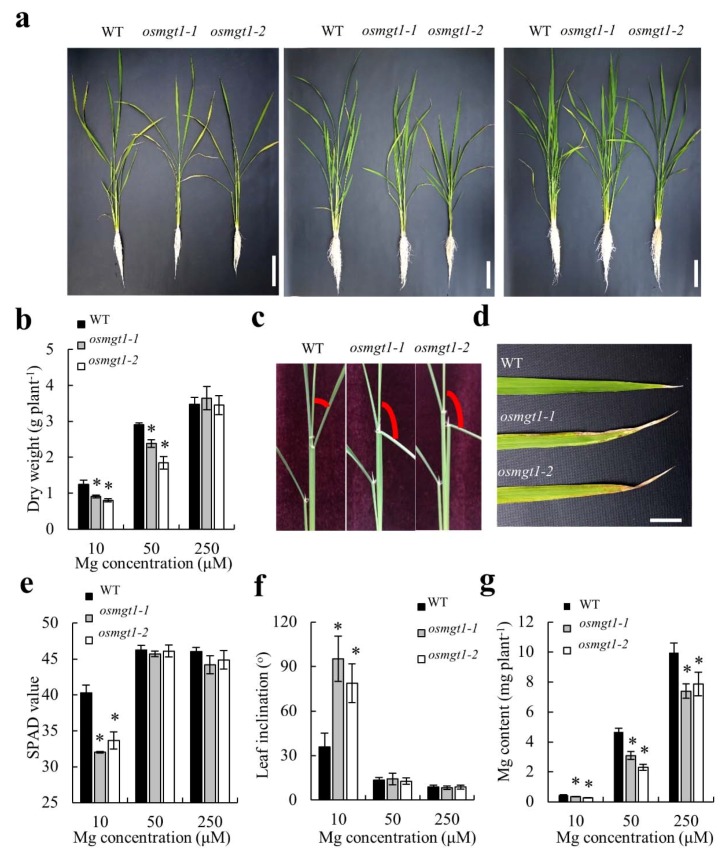
Figure 3.
Sensitivity of OsMGT1 knockout lines to Mg deficiency. Seedlings of both of WT and two OsMGT1 knockout lines were grown with different Mg concentrations (a). Growth conditions (a). Left, 10 µM; middle, 50 µM; right, 250 µM. Dry weight (b), leaf chlorosis (d), spectral plant analysis diagnostic (SPAD) value (e), Mg content (g) and leaf inclination (c,f). Data are means ± SD (n = 3). The asterisk shows a significant difference compared with WT (p ≤ 0.05 by Tukey’s test). Bars = 10 cm (a) and 2 cm (d).

