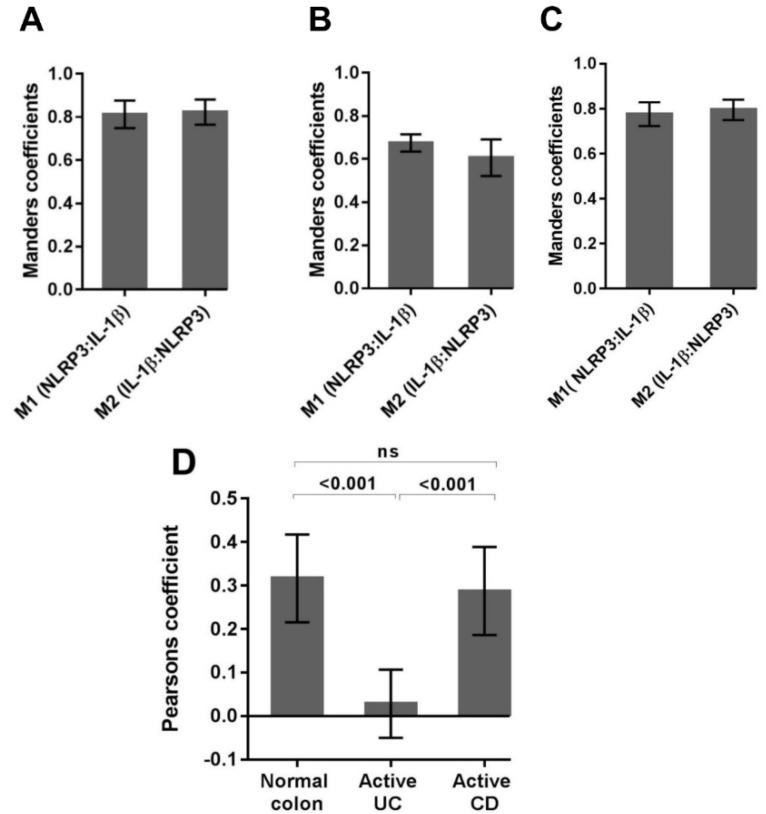
Figure 6.
The colocalization of NLRP3 and IL-1β in normal and active disease as indicated by Manders colocalization coefficients and Pearson’s correlation coefficients. Each data set was compiled from lamina propria regions of interest (ROI), 400× images from (A) normal colon (n = 20), (B) active UC (n = 20), (C) active CD (n = 20). Manders coefficients (M1 and M2) were used to evaluate the reciprocal association ratio between fluorescence markers. (D) The Pearson’s correlation coefficient describes the fluorescence intensity distribution between the channels. Averages are presented as mean + standard deviation. Significance was tested using one-way ANOVA followed by Tukey’s multiple comparison test. The significance threshold was p < 0.05.

