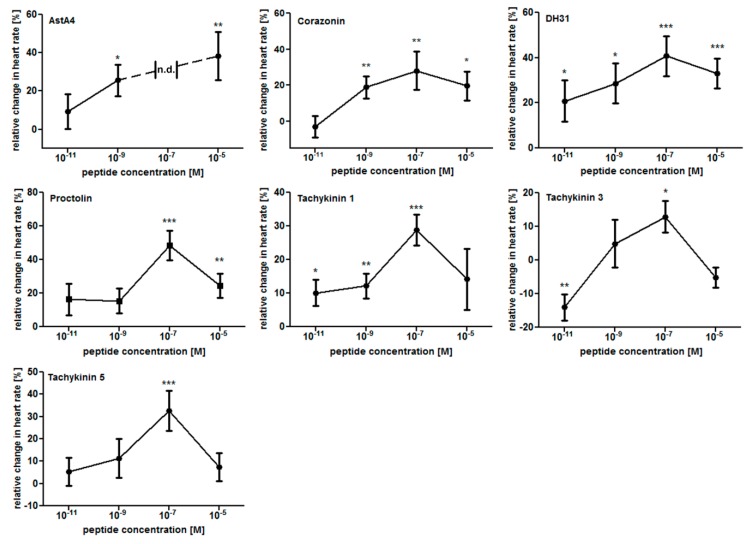
Figure 2.
Dose–response curves for the effects of chronotropic peptides in semi-intact Drosophila larvae. Individual effects of the tested peptides at 1 × 10⁻¹¹ M, 1 × 10⁻⁹ M, 1 × 10⁻⁷ M, and 1 × 10⁻⁵ M are shown. Data are presented as mean values (± S.E.M.) of the relative changes in heart rate in relation to the individual control preparations (prior to peptide application). A minimum of ten animals per peptide were measured. Significance levels are indicated by asterisks (paired sample Student´s t-test, * p < 0.05; ** p < 0.01; *** p < 0.001). n.d. indicates “not determined” (due to heartbeat arrest).

