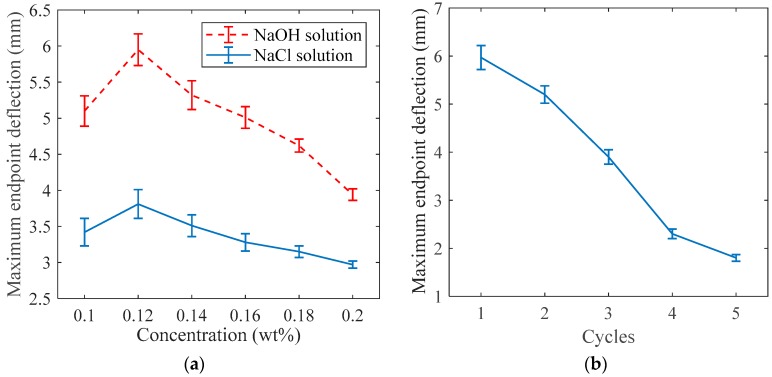
Figure 4.
(a) Response of the actuators with the same pattern and dimensions to different electrolyte solutions. (b) Maximum endpoint deflections of the actuators to 5 V input signal over different cycles. Error bars indicate the standard deviation of the maximum distance measured over the three trials.

