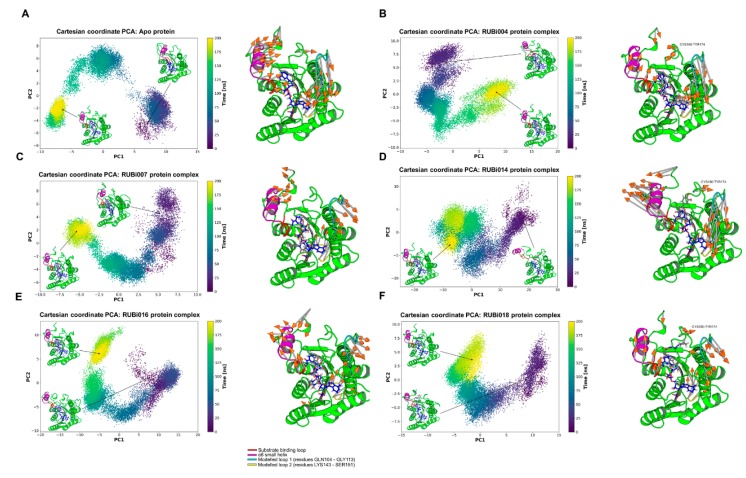
Figure 9.
Principal component analysis of the TbPTR1 apo protein and TbPTR1-ligand complexes. The motion of the protein during 200 ns of the all-atom MD simulation is shown along the first and second principal components (PC1 and PC2). The substrate binding loop (residues SER207–GLU215) is colored red, the α6 alpha helix (residues GLY214–VAL225) is colored magenta, the modelled missing residues loop 1 is colored cyan, the modelled missing residues loop 2 is colored yellow, and the NADPH cofactor is colored blue. (A) Apo protein, (B) TbPTR1-RUBi004 complex, (C) TbPTR1-RUBi007 complex, (D) TbPTR1-RUBi014 complex, (E) TbPTR1-RUBi016 complex, and (F) TbPTR1-RUBi018 complex. For each of these, on the left is the projection of the protein-ligand complex dynamics along the PC1 and PC2, and on the right are the differential motions described by PC1 and PC2, shown by light gray arrows with orange tips.

