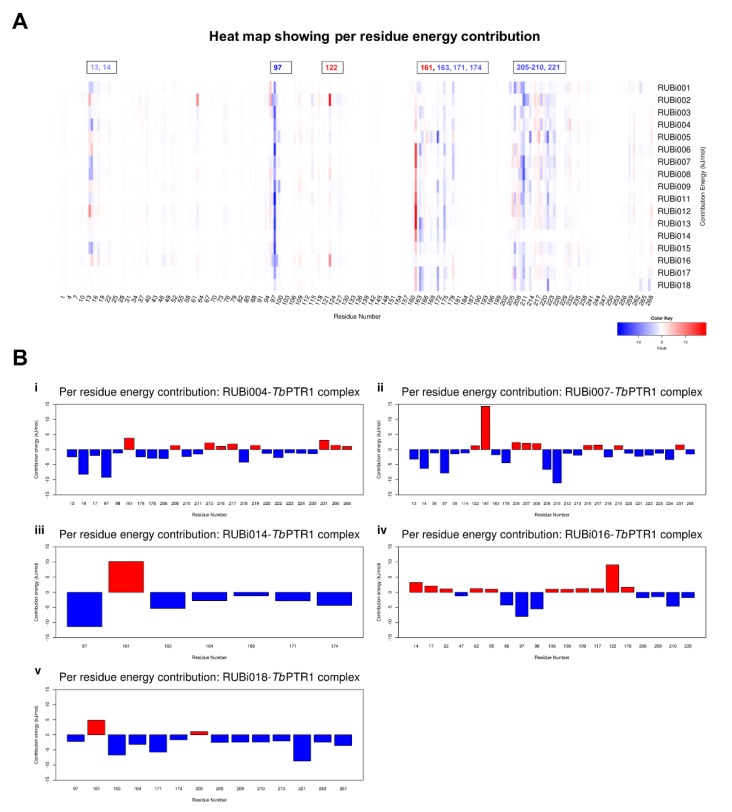
Figure 10.
A heat map and histograms showing the per residue energy contributions to binding (with energy in kJ/mol). The compounds bound in similar conformations to known pterin, folates, and PTR1 inhibitors, as is shown by the common contributing residues to binding. (A) A heat map showing the per residue energy contributions for all the protein-ligand systems and (B) a histogram showing the main residues contributing energetically to binding in (i) TbPTR1-RUBi004, (ii) TbPTR1-RUBi007, (iii) TbPTR1-RUBi014, (iv) TbPTR1-RUBi016, and (v) TbPTR1-RUBi018 complexes.

