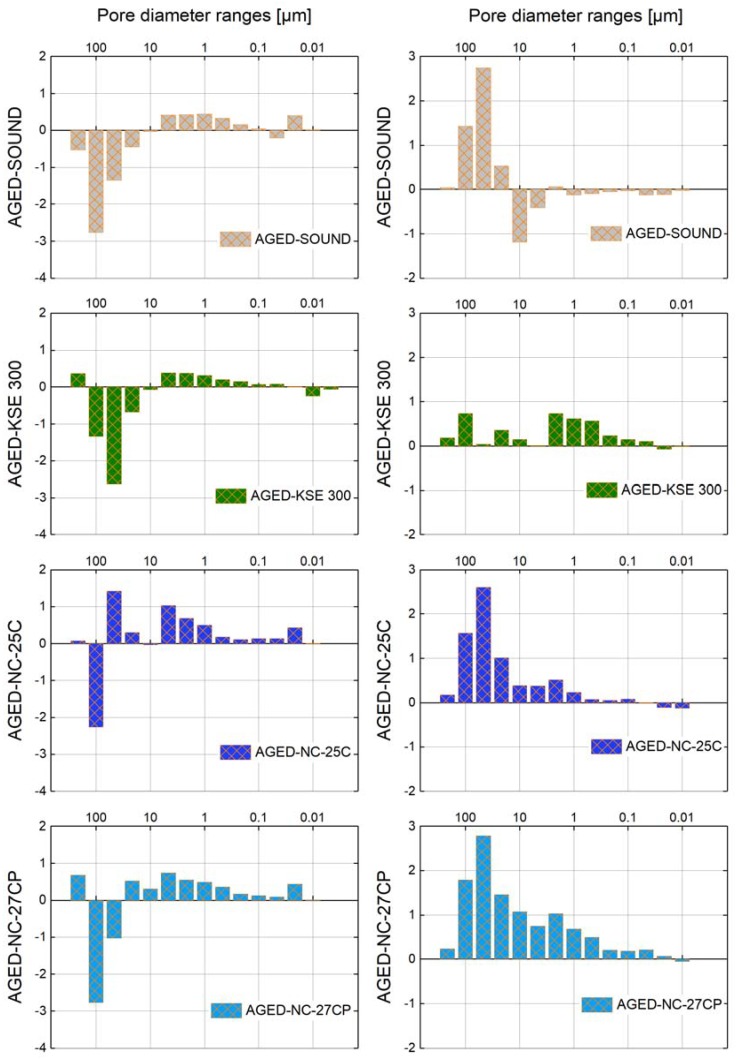
Figure 4.
Differences in open porosity for each class of pores determined from the Hg-intrusion porosimetric data. Results for St. Margarethen Limestone (left side) and Schlaitdorf Sandstone (right side). To read this comparative graph, from aged to sound conditions, the positive values represent the newly created pores in the respective class. When comparing ages to consolidated conditions, the positive values represent the amount of pores that were filled with the consolidant. Negative values for treated St. Margarethen Limestone in the range of pores higher than 10 µm would represent an increase in large pores caused by a treatment, which signify a physical impossibility and are due to the inhomogeneous nature of this lithotype.

