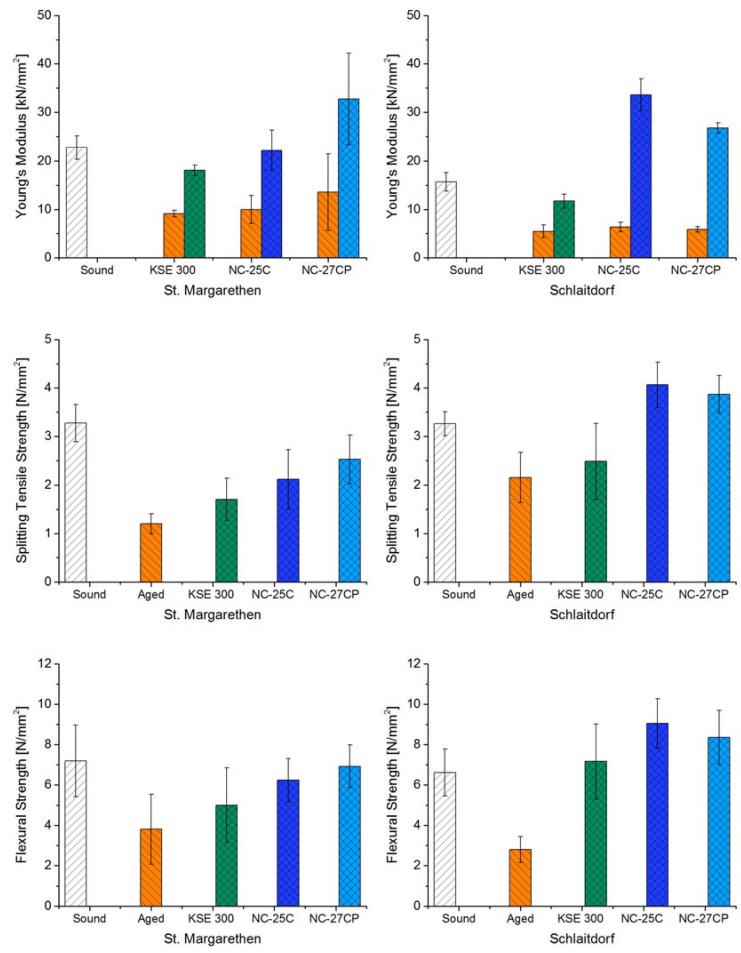
Figure 6.
Illustration of Young’s modulus [kN/mm2], splitting tensile strength [N/mm2], and flexural strength under concentrated load [N/mm2] for St. Margarethen Limestone (left side) and for Schlaitdorf Sandstone (right side). All tests performed six months after consolidation. Please note that the dynamic modulus of elasticity was performed on the same specimens before and after treatment. Bars with orange filling represent aged samples before consolidation.

