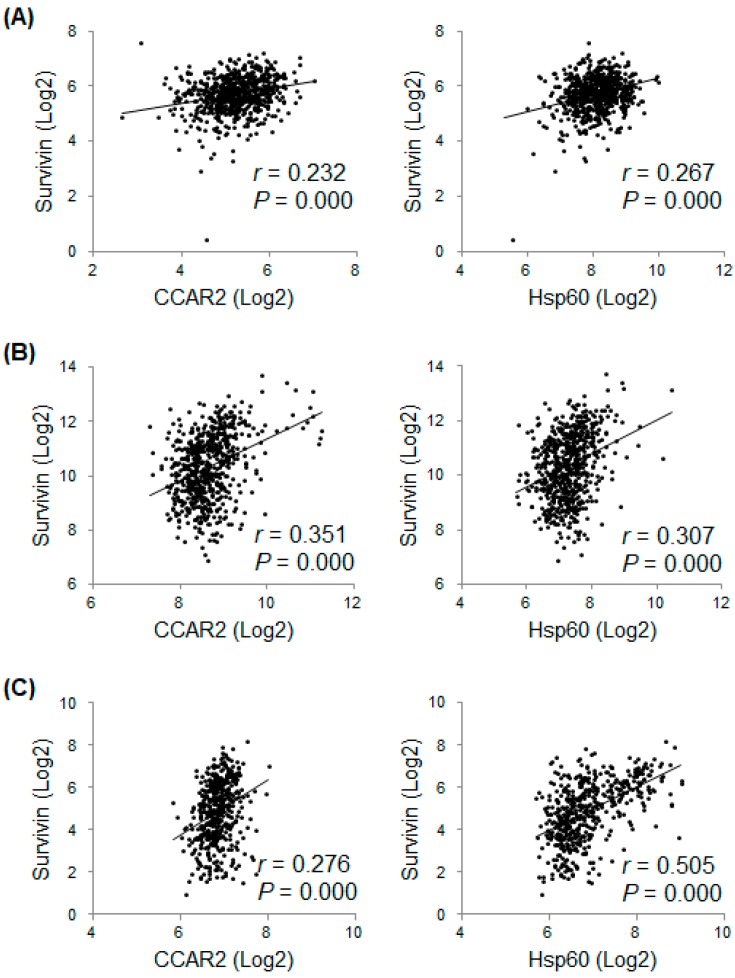
Figure 4.
Expression of survivin mRNA in human cancer cell lines and neuroblastoma tissues shows a positive correlation with that of CCAR2 and Hsp60. Expression of mRNAs encoding CCAR2, Hsp60, and survivin was downloaded from a publicly available database that included the data from commonly used human cancer cell lines (E-MTAB-2706, n = 675) (A), neuroblastoma tumors (GSE45547, n = 649) (B), and neuroblastoma tumors (GSE62564, n = 498) (C). Expression of each mRNA value was Log2-transformed. Pearson’s correlation analysis was used to examine the relationship between each mRNA. r, Pearson’s correlation coefficient; P, P-value.

