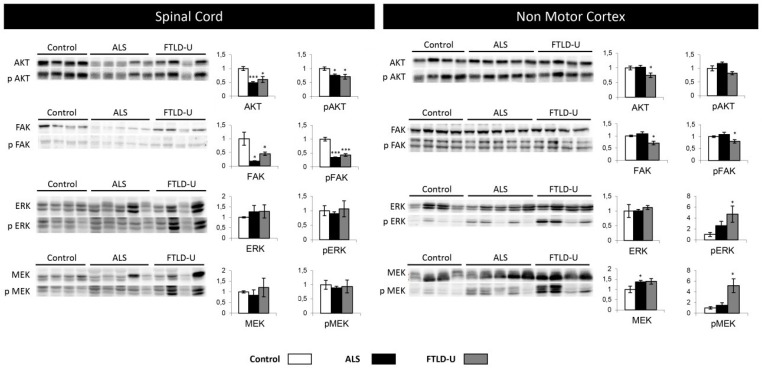
Figure 5.
Cell signaling. Differential regulation in ALS and FTLD-U in different CNS regions. The left side of the figure shows the results for all the signaling proteins measured in spinal cord, while the right side of the figure shows the results obtained in non-motor cortex. In each plot (y axes) the optical density (in arbitrary units) is measured for control samples (white), ALS samples (black) and FTL-D samples (grey) are represented. * p value < 0.05, *** p value < 0.001.

