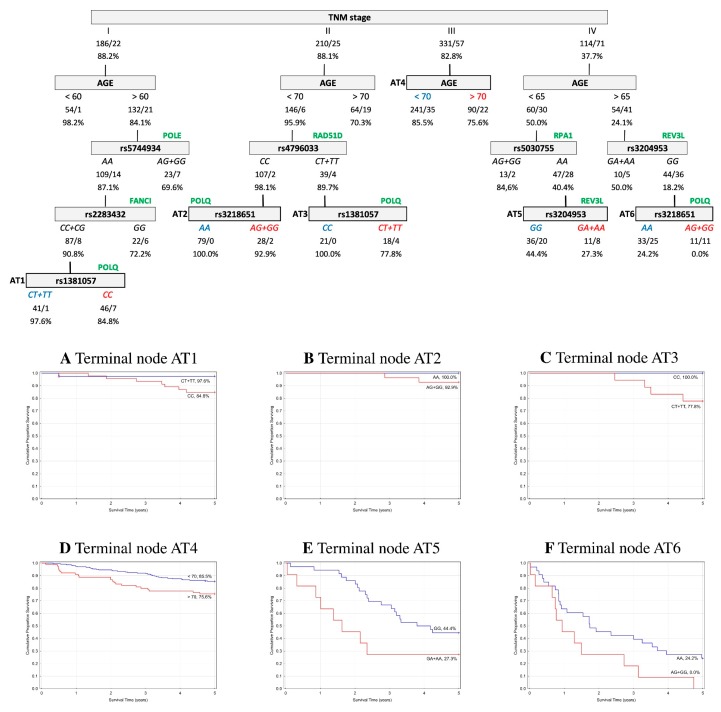
Figure 2.
Overall survival (OS) classification and regression tree analysis of colorectal cancer patients from Austria. Numbers under each node indicate the total number of cases in the subcategory/number of events, and the percentage of patients with five-year OS. Terminal nodes are bordered in bold, and the corresponding Kaplan–Meier curves are shown underneath. (A) Terminal node AT1; (B) Terminal node AT2; (C) Terminal node AT3; (D) Terminal node AT4; (E) Terminal node AT5; (F) Terminal node AT6.

