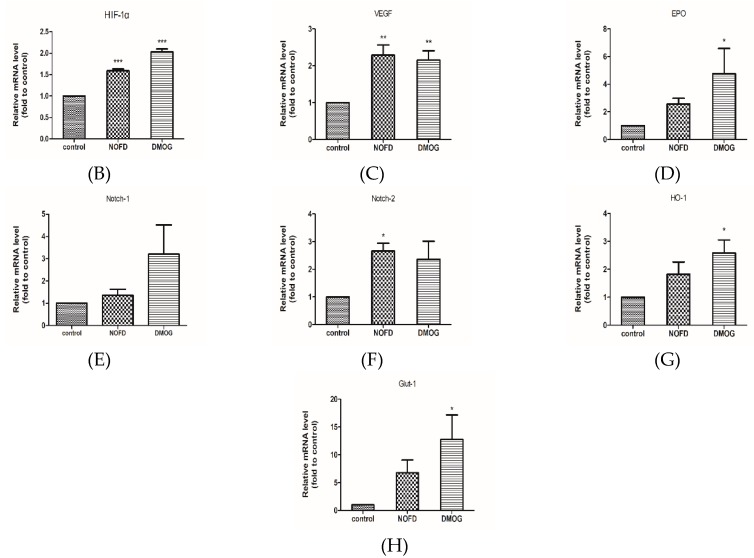
Figure 5.
NOFD up-regulates HIF-1α protein level and the expression of related genes in HCT16 cells. (A) The bar shows the level of HIF-1α protein in HCT116 cells. (B–H) The bar graphs show the mRNA expression of HIF-1α VEGF, EPO, Notch-1, Notch-2, Glut-1, and HO-1 in HCT116 cells (mean ± SD, n = 3). * p < 0.05, ** p < 0.01 and *** p < 0.001 vs. control.


