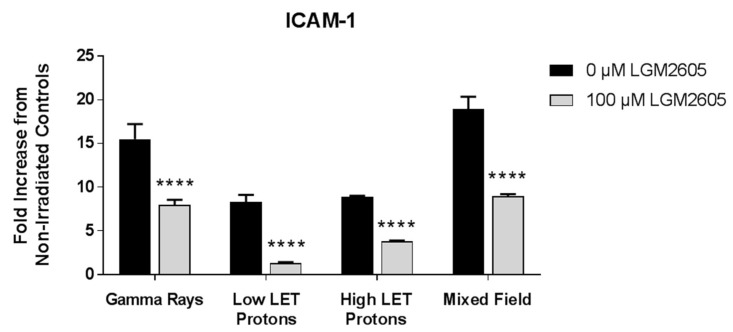
Figure 10.
A comparative evaluation of ICAM-1 expression post radiation exposure (0.5 Gy). Fluorescent images of FAECs exposed to gamma rays, low LET protons, high LET protons, and mixed field gamma and proton radiation were quantified. Data are normalized to the respective non-irradiated controls and presented as fold increase over controls. Data are presented as mean ± SEM. Asterisks shown in figures indicate significant differences from FAECs exposed to 0.5 Gy radiation and treated with 0 µM LGM2605 (**** p < 0.0001).

