
Figure 3.
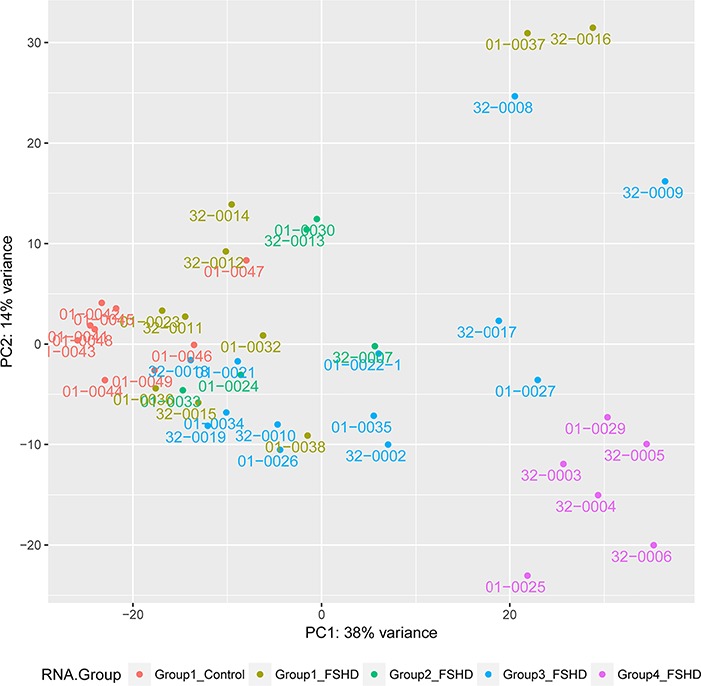
Principle component analysis based on total RNA sequencing data. Colors identify groups defined in Figure 1 based on the key at the bottom of this figure. Although FSHD groups 1, 2, 3 and 4 generally show progressively distinction from the group 1 controls, samples 01-0037 and 32-0016 represent outliers in the FSHD group 1 samples.