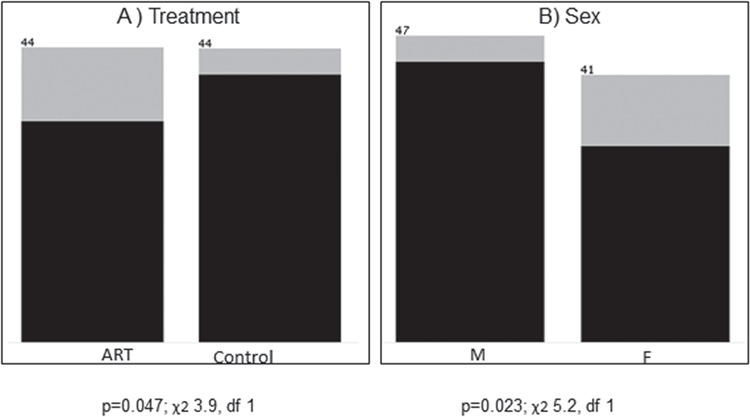
Figure 2.

Association with outlier DNA methylation profile. Clinical attributes, ART status (A) and sex (B) are ranked by association with outlier DNA methylation. For each attribute value, number of data samples is shown above each bar. Light gray represents the portion of outliers within each clinical attribute and black represents the non-outliers. P-values of chi-square test (χ2), no correction, df = degrees of freedom, missing values excluded.
