Figure 3.

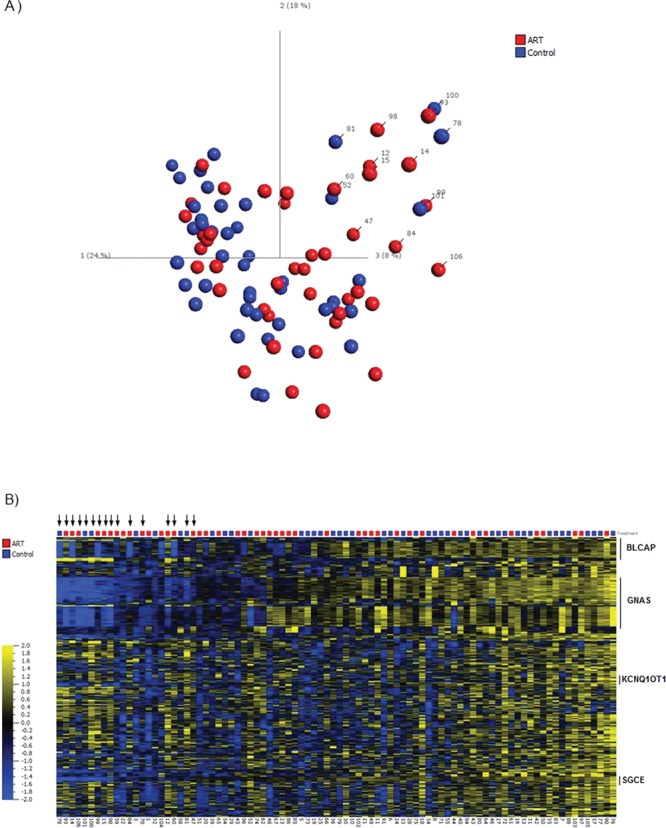
(A) PCA analysis of imprinted regions. We selected 602 CpG sites that overlap known differentially methylated regions associated with imprinted genes or domains. Red color represents ART and blue color represents controls. (B) Heatmap analysis of imprinted regions. Heatmap was generated using DNA methylation levels for 602 CpG sites overlapping known differentially methylated regions associated with imprinted genes or domains. Samples are sorted based on principal component 1 (PC1) as per Figure 3A. Variables are sorted based on gene symbols. Sample annotation is displayed at the bottom of the heatmap. Black arrows represent outlier samples identified in Figure 1. Red color represents ART and blue color represents controls. For the heatmap, data are normalized for visualization (mean = 0, variance = 1).
