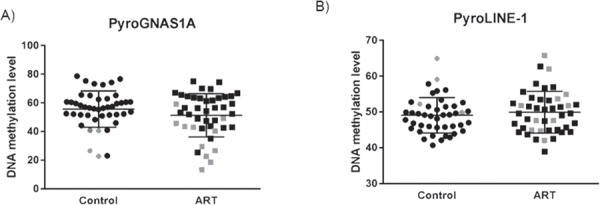
Figure 4.

Pyrosequencing validation of targeted imprinted region and LINE-1 elements. We selected an imprinted region GNAS1A (A) for pyrosequencing validation in 44 ART and 44 controls. The scatter plot is showing the distribution of the DNA methylation levels across the different samples. Outliers represent the samples that deviate in their DNA methylation values from the overall DNA methylation levels within each group of samples. (B) Pyrosequencing analysis of the repeat elements LINE-1 in controls and ART samples. Gray color represents outliers in both ART and controls.
