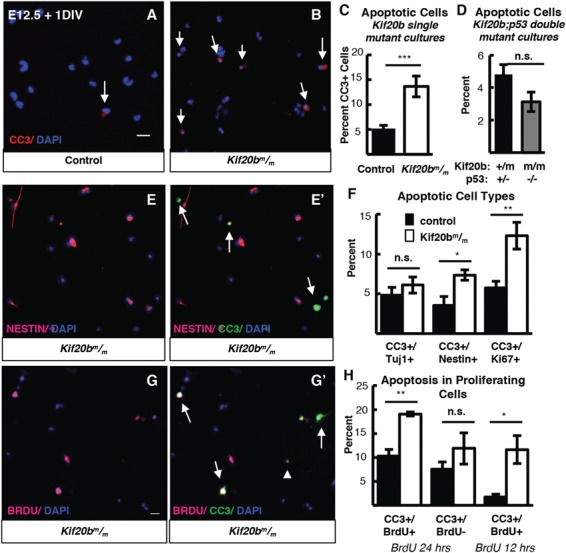
Figure 6.

Kif20b loss causes apoptosis in proliferating cortical NSCs. (A, B) Representative fields of control (left) and Kif20b (right) dissociated cortical cultures labeled with CC3 (red, arrows) for apoptotic cells. (C) The mean percentage of apoptotic cells in Kif20b
 cortical cultures is increased (>2-fold) above controls. n = 13 control, 11 mutant coverslips; 8 and 7 brains, 7 litters. (D) Apoptosis is not increased in Kif20b; p53 double mutant cultures. n = 4 Kif20b+/m; p53+/−, 3 Kif20b
 ; p53−/− coverslips; 3 and 2 embryos, 2 litters. (E) Representative fields labeled with Nestin (NSCs, pink) (E,E’) and CC3 (green) (E’). Arrows in E’ indicate cells co-positive for Nestin and CC3. (F) The percent of apoptotic neurons (CC3+/Tuj1) is not increased in Kif20b mutant cultures, but the percent of apoptotic NSCs and proliferating NSCs (CC3+/Nestin+; CC3+/Ki67+) are significantly increased. Tuj1/CC3 analysis: n = 7 control, 6 mutant coverslips; 4 and 3 brains, 4 litters. Nestin/CC3 analysis: n = 7 control, mutant coverslips; 4 brains each, 3 litters. Ki67/CC3 analysis: n = 6 control, 5 mutant coverslips; 3 brains each, 3 litters. (G) Representative fields labeled with BrdU (cells that incorporated BrdU, pink, G, G’) and CC3 (green,
G’). Arrows in G’ indicate cells co-positive for BrdU/CC3, and arrowhead indicates a cell negative for BrdU but positive for CC3. (H) Apoptosis is associated with proliferation in Kif20b mutant NSCs. Significantly more BrdU+ cells are apoptotic (CC3+) in Kif20b mutant cultures than control cultures, but BrdU− cells show no increase in apoptosis, when BrdU was in the bath for the 24 h culture period. When BrdU is given for the last 12 h before fixing at 24 h, the percent of apoptotic BrdU+ cells are also increased in Kif20b mutant cultures compared to control. For 24 h experiment, n = 3 control and mutant coverslips from 3 embryos and 2 litters. For 12 h experiment, n = 4 control and mutant coverslips from 3 embryos and 2 litters. Control denotes a combination of Kif20b+/+ and Kif20b+/m embryos. *P < 0.05, **P < 0.01, ***P < 0.001, Student’s t-test. Error bars are +/− s.e.m. All cultures from E12.5 cortices and fixed after 24 h. Scale bars in A, E, H: 20 μm.
