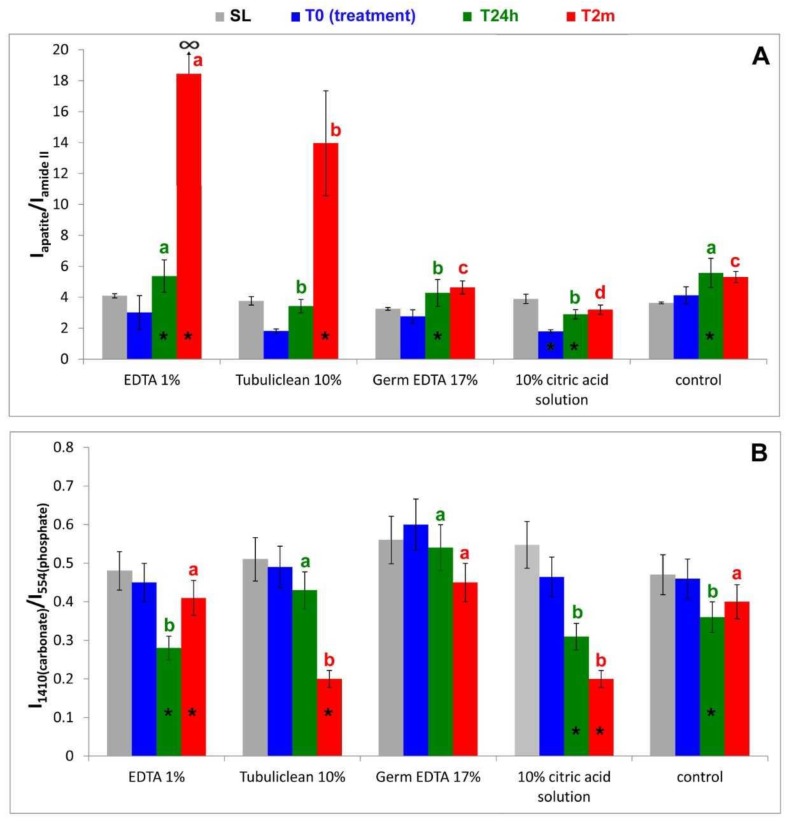
Figure 11.
Values of the Iapatite/Iamide II (A) and I1410(carbonate)/I554(phosphate) (B) ratios (average ± standard deviation), as calculated from the IR spectra recorded on the dentin surfaces under study, submitted to sanding (SL, grey), treatment with 1% EDTA, 10% EDTA (Tubuliclean 10%), 17% EDTA (Germ EDTA 17%), 10% citric acid solution, or water (blue), aging in SBF for 24 h (T24h, green) and two months (T2m, red). The asterisks on the histogram bars indicated significant differences with respect to the value observed in the previous step of the study within the same treatment. Identical letters represent no statistical differences (P ≥ 0.05) among tested solutions at T24h or T2m.

