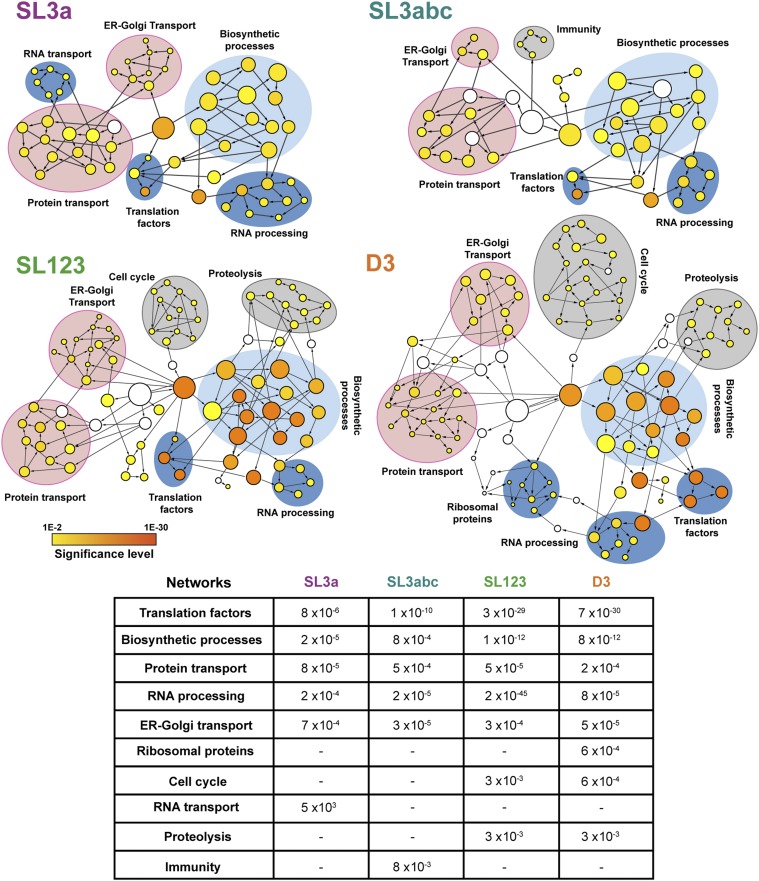
Figure 2. Functional networks of proteins associated with SL3a, SL3abc, SL123, and D3 transcripts.
Circles depict functionally related nodes obtained with the application BiNGO (Cytoscape platform). The area of a node is proportional to the number of proteins in the test set annotated to the corresponding GO category, and the color intensity indicates the statistical significance of the node according to the colored scale bar. White nodes are not significantly overrepresented; they are included to show the coloured nodes in the context of the GO hierarchy. Arrows indicate branched nodes. Networks are shadowed blue, pink, or grey, according to the functional process. The mean statistical significance (P value) of the networks obtained for each domain relative to a complete human proteome is indicated on the bottom panel. A dash depicts networks with P values > 10−2.

