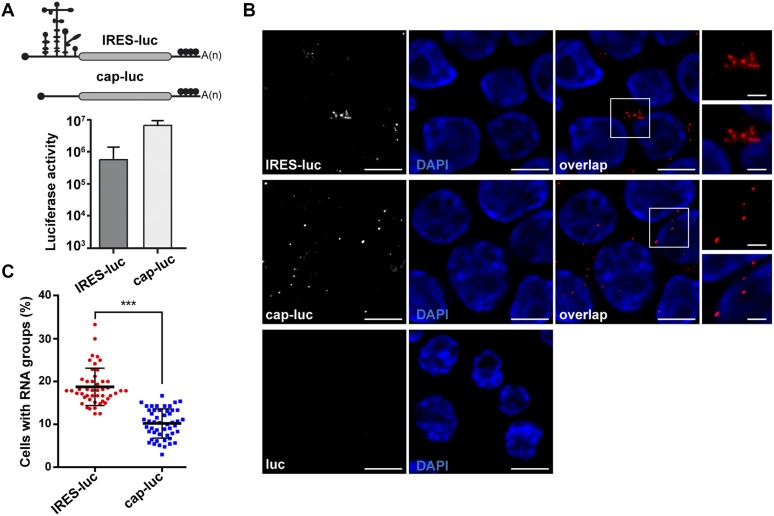
Figure 5. The mRNA bearing the IRES element is arranged in cytoplasmic clusters.
(A) Schematic representation of IRES-luc and cap-luc mRNAs (top), and luciferase activity (RLU/μg protein) in transfected HeLa cells (bottom). Values represent the mean ± SD obtained in triplicate assays. (B) Representative images of RNA-FISH assays conducted with cells transfected side by side with plasmids expressing IRES-luc mRNA, cap-luc mRNA, or pluc (a control plasmid lacking the CMV promoter but containing the luciferase cDNA sequence). Cells were fixed 30 h post-transfection, permeabilized, and incubated with the probe targeting the luciferase-coding region. Cell nucleus was stained with DAPI. White rectangles denote images enlarged on the right panels. (C) Quantification of RNA clusters in cells expressing IRES-luc or cap-luc RNA. The number of RNA spots in single cells (positive luciferase RNA expression) was determined and represented as a percentage of total transfected cells according to their degree of association (≥3 spots in 3 μm). Three independent experiments were conducted. In total, 257 and 162 RNA groups/cell were counted in cells expressing IRES-luc or cap-luc RNA, respectively (P = 3.7 × 10⁻¹⁸) (bar = 10 μm overlap image; crop image, 3 μm.)

