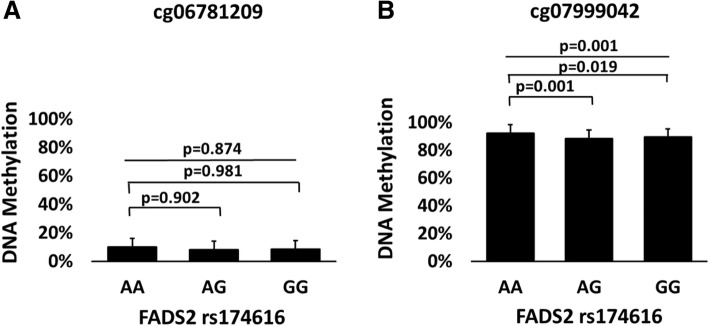
Fig. 3.
FADS2 DNA methylation levels according to groups based on FADS2 genotype. Panels (a) and (b) show DNA methylation levels in cg06781209 and cg07999042 according to FADS2 genotype (n = 88). Statistical significance was calculated with one-way ANOVA or a one-way Welch ANOVA with Bonferroni post-hoc test and nominal p values are presented

