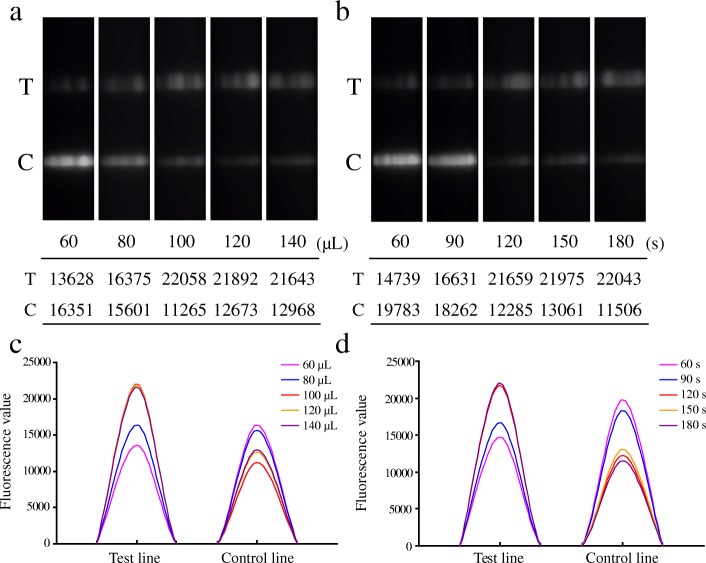
Fig. 2.
Assay condition optimization for LFIA. a The working reaction solutions containing the purified PCR products (20 μL) and running buffer with different volumes of 40 μL, 60 μL, 80 μL, 100 μL and 120 μL was tested. b The reaction time was optimized by adding 100 μL working reaction solution and incubating for 60 s, 90 s, 120 s, 150 s, 180 s at room temperature. The images of test (T) and control (C) lines were recorded by fluorescence imager. The fluorescence signals of test and control lines in c and d correspond to Fig. 2a and b, respectively

