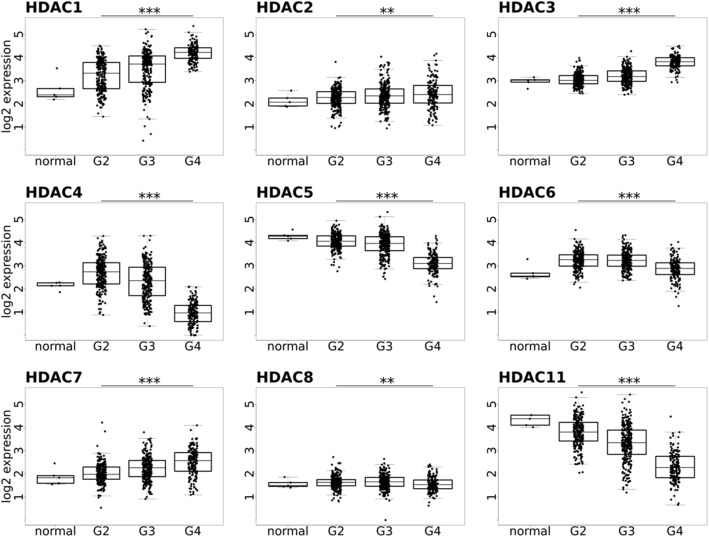
Fig. 2.
Expression of HDAC 1–8 and 11 in gliomas. Data were acquired from the TCGA repository as data level 3, FPKM values and include 5 normal brain samples (normal), 248 grade II (G2), 261 grade III (G3), and 160 grade IV (G4) tumor samples. Data were quantile normalized and log2 transformed. ANOVA test with no assumption of equal variance (Welch one-way test) was performed on all G2, G3, and G4 samples. Significant differences of means between G2, G3, and G4 were observed and denoted as significant after FDR corrections for multiple testing: *p value < 0.05, **p value < 0.01, ***p value < 0.001

