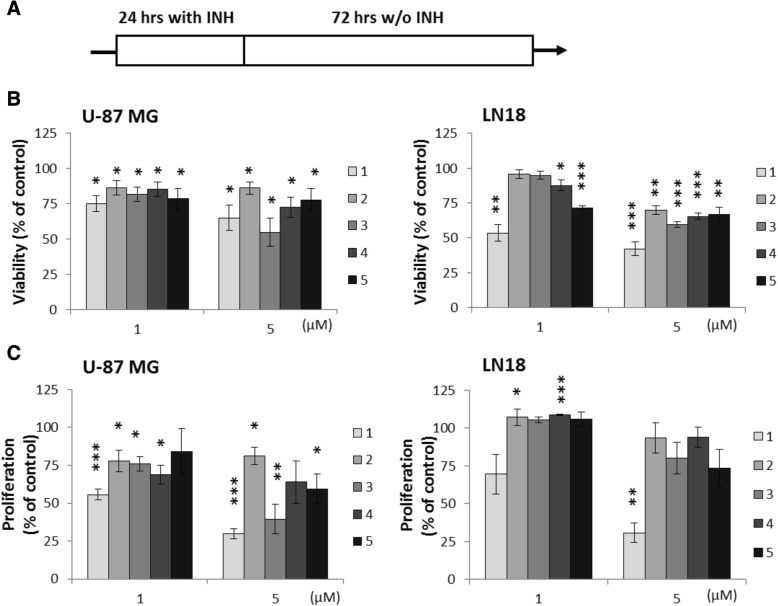
Fig. 6.
Long-term effects of 1–5 on glioma cell viability and proliferation. a Scheme of the experiment—the cells were exposed to 1–5 for 24 h, then HDACi were washed out and cells were cultured for another 72 h. b MTT metabolism test for cell viability of U-87 MG and LN18 cells after exposure to 1–5 at indicated concentrations. c BrdU incorporation test for cell proliferation of glioma cell after exposure to 1–5 at indicated concentrations. Values for untreated cells were taken as 100%. The respective p values were calculated using type 2 two-tailed t test, and p < 0.05 was considered statistically significant. n = 3, *p value < 0.05, **p value < 0.01, ***p value < 0.001

