Fig. 2.

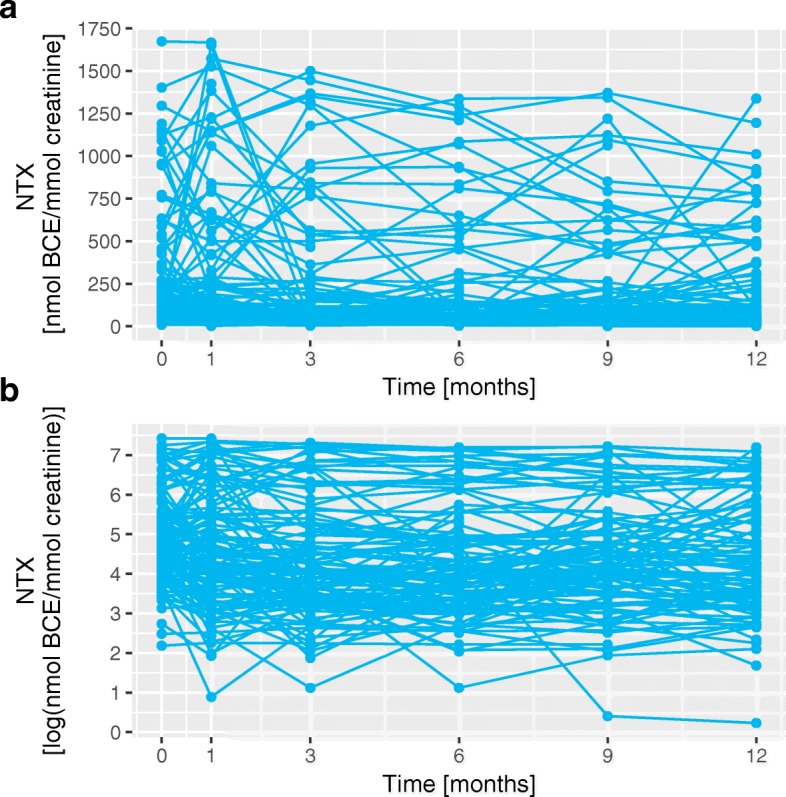
Comparison between NTX and log(NTX) trajectories. Graphical representation of the values of NTX and log(NTX) for all the patients. Panel a represents the original values and panel b represents the log-transformed values

Comparison between NTX and log(NTX) trajectories. Graphical representation of the values of NTX and log(NTX) for all the patients. Panel a represents the original values and panel b represents the log-transformed values