Fig. 6.

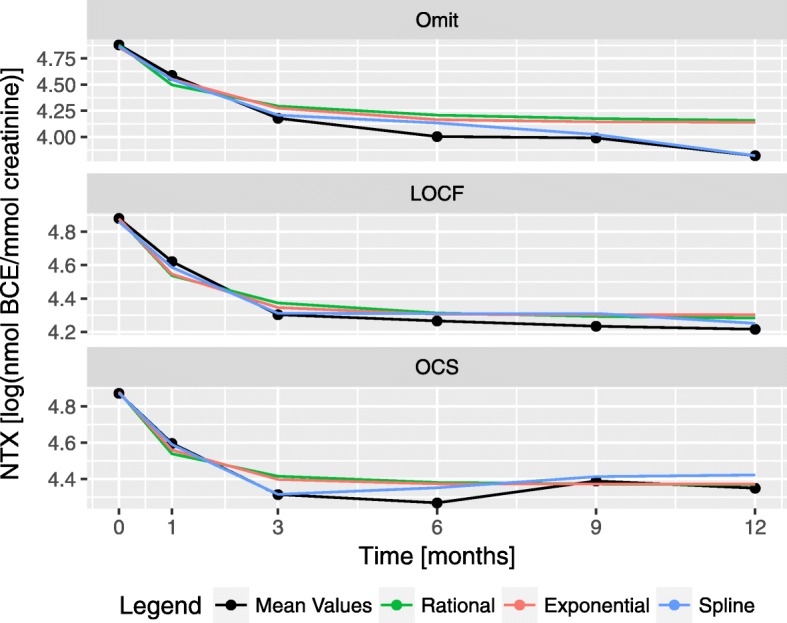
Population fits for the longitudinal models. The nine longitudinal fits from Table 4 are represented alongside the population mean for each of the imputation types

Population fits for the longitudinal models. The nine longitudinal fits from Table 4 are represented alongside the population mean for each of the imputation types